Anthony Whipple
 Research Specialist in Physical Oceanography at the University of North Carolina’s Institute of Marine Sciences since mid 2001 specializing in observational physical oceanography. Areas of expertise include engineering, including instrumentation, data collection methodology and design and implementation of novel data collection equipment. Bridging the gap between research and engineering, projects include:
Water quality and dynamics of inland reservoirs: B. Everett Jordan Lake, and Falls Lake
Researchers from UNC and NC State are conducting research projects which include monitoring and data Collection in Jordan Lake and Falls Lake
One major component of the study involves a multi-part observational program of Jordan and Falls Lake’s water circulation, water quality, and other relevant factors affecting movement and quality. Much of the data being collected as described below can be viewed on the web site http://jordanlakeobservatory.unc.edu. Specific objectives of the observational program are:
- To identify water circulation and exchanges in the lake.
- To better quantify the response of important water quality parameters in the lake based on changing conditions (variations in flow, temperature, light and wind) via high frequency (hourly) in situ observations.
- To better quantify phytoplankton dynamics, including nutrient limitation and productivity that are causing the lake to be out of compliance with water quality standards.
Autonomous Vertical Profilers
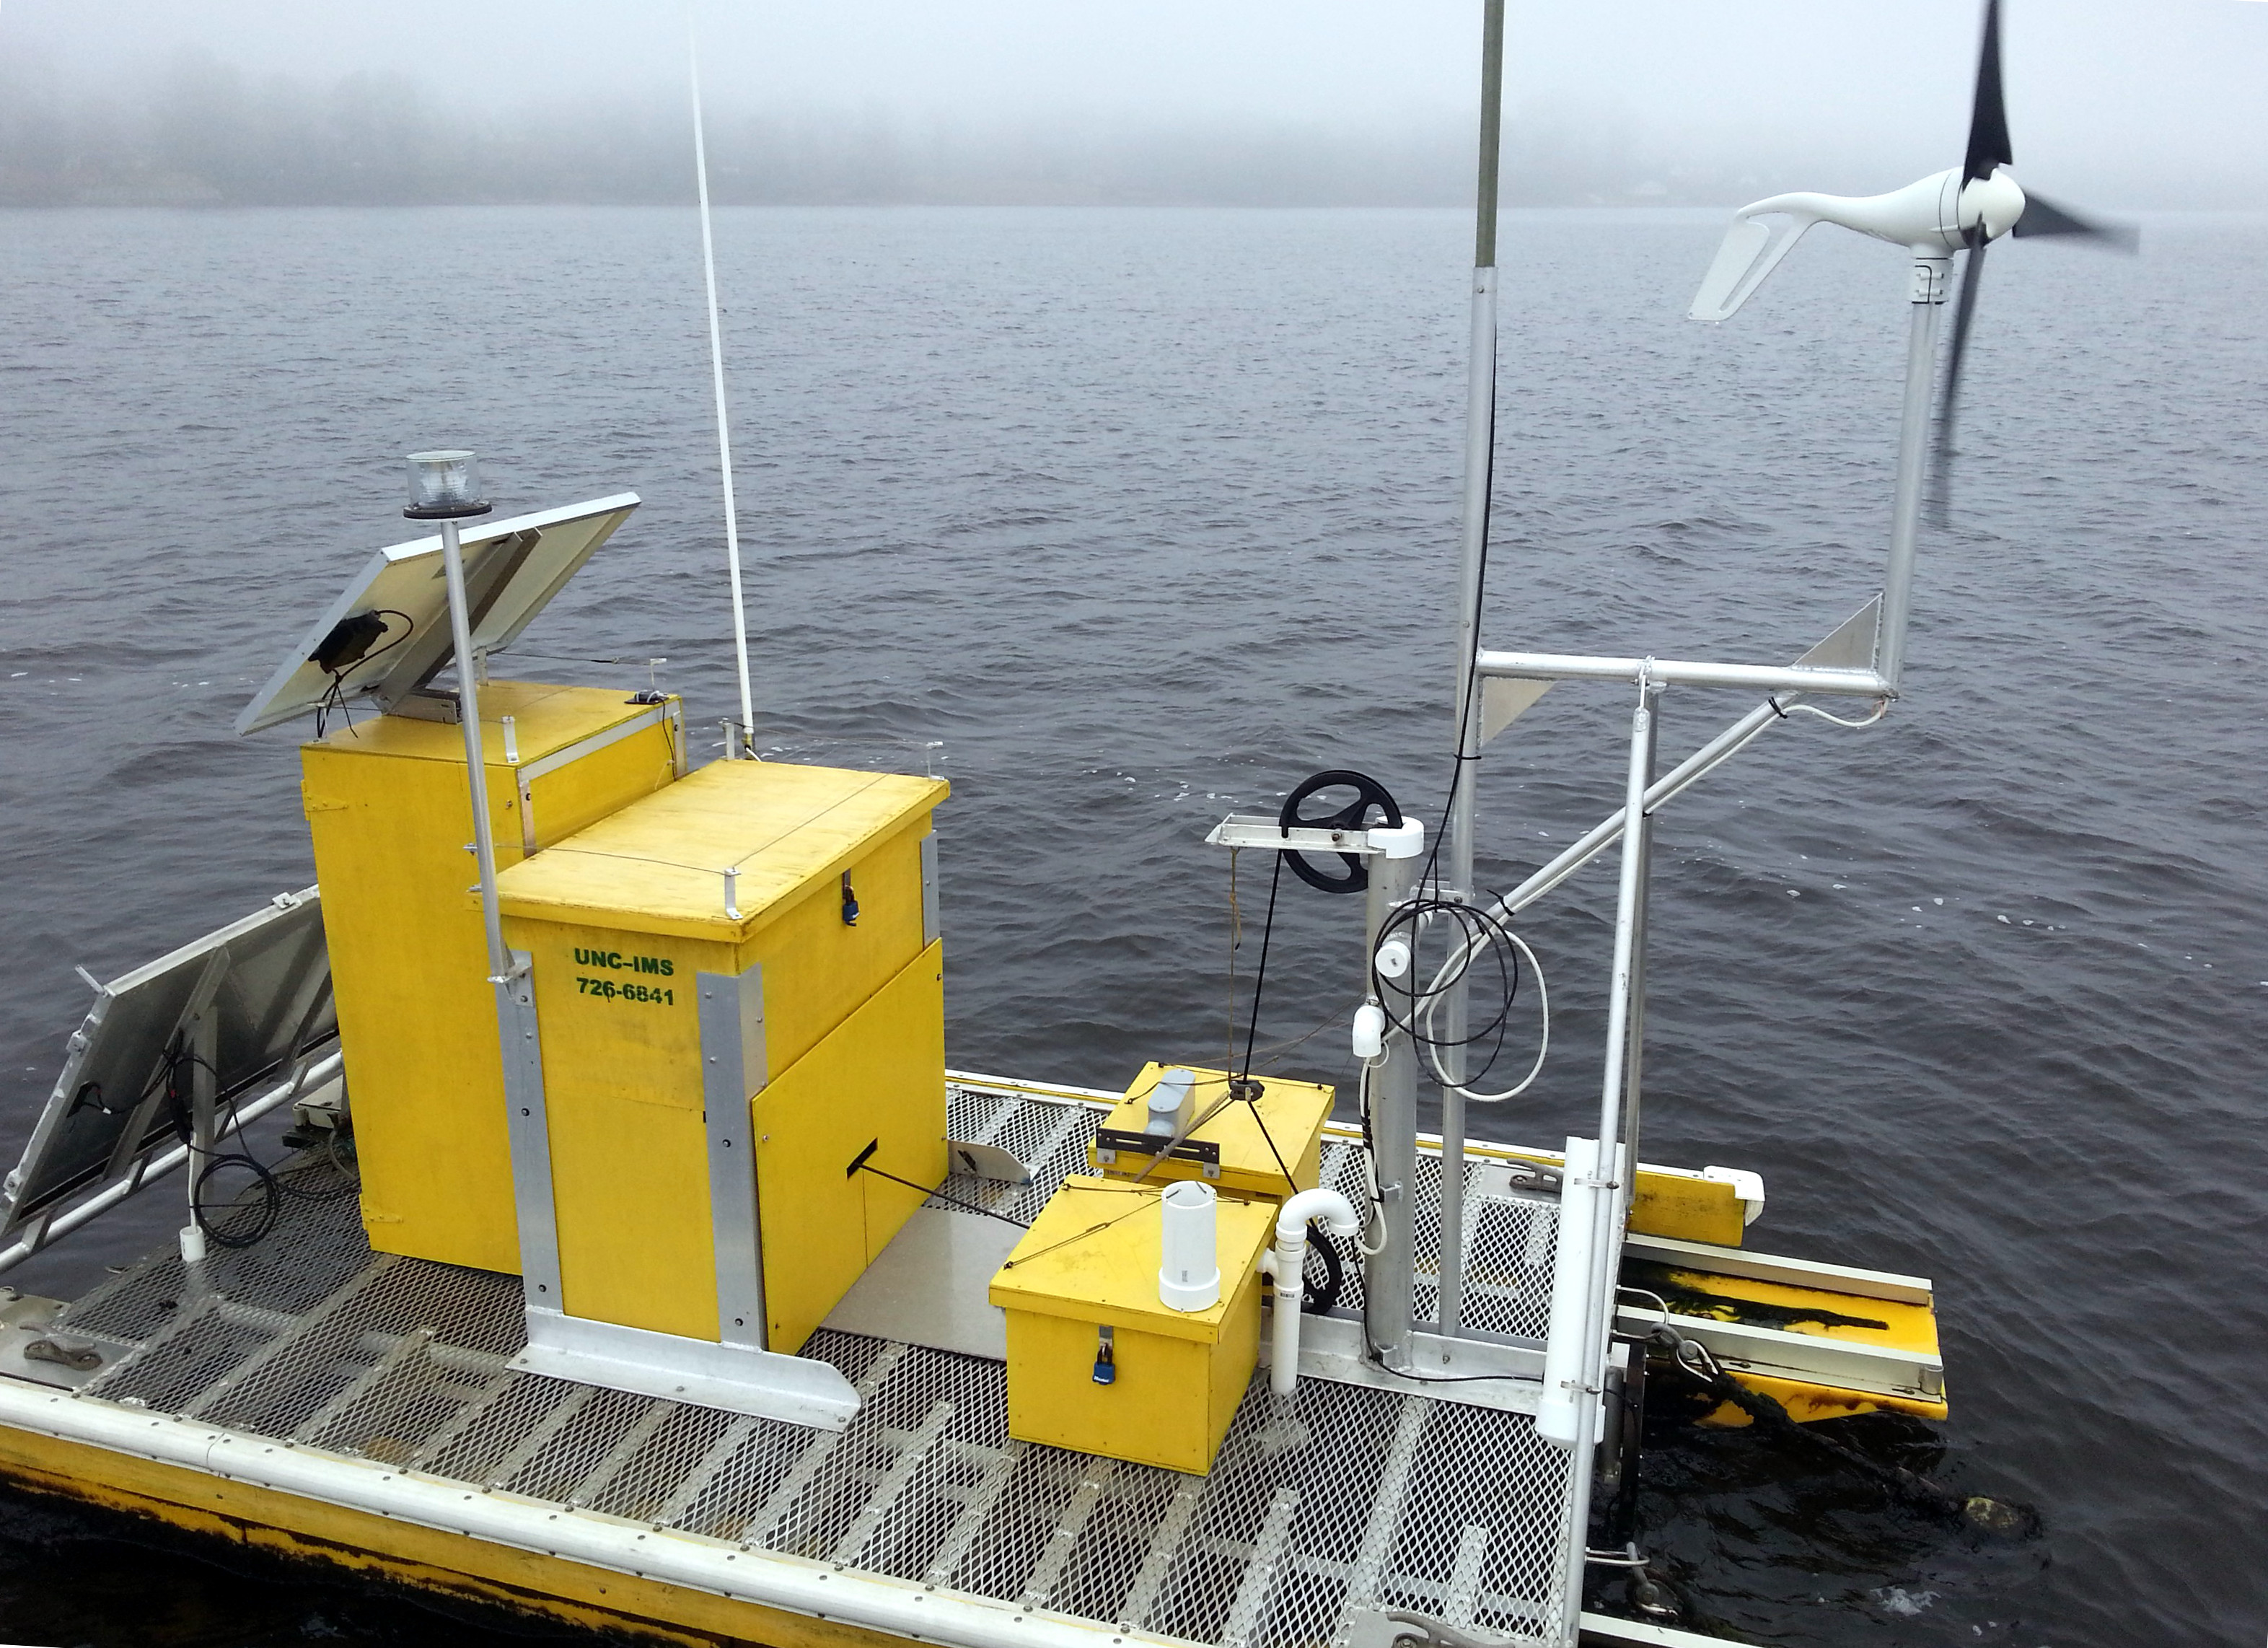
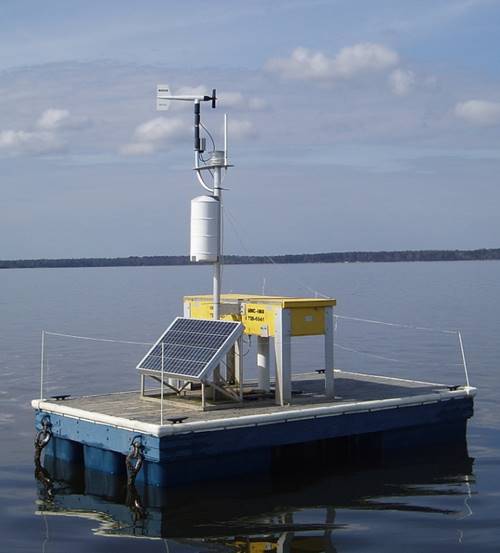
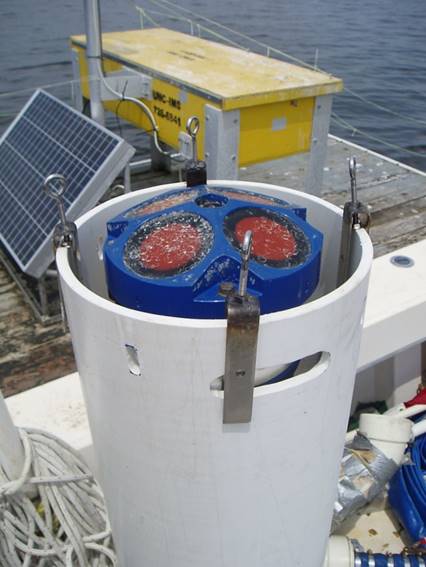
Our lab at the University of North Carolina at Chapel Hill’s Institute of Marine Sciences (IMS) in Morehead City has been developing and building versions of the Autonomous Vertical Profiler (AVP) since the late 1980’s. As the profilers have evolved through subsequent versions, we have added functionality, greatly improved reliability, maintainability and expandability. The latest design is based as much as possible upon open-source software and standards based hardware. The profiler’s principal function is to provide data on the characteristics of the water from surface to bottom over time. The profiler lowers a water quality instrument from the surface to the bottom while recording data such as depth, temperature, salinity, dissolved oxygen, chlorophyll concentration and turbidity. At the same time, we are also collecting wind and water depth data. Altogether this data provides a time-series of how key aspects of a water body are behaving.
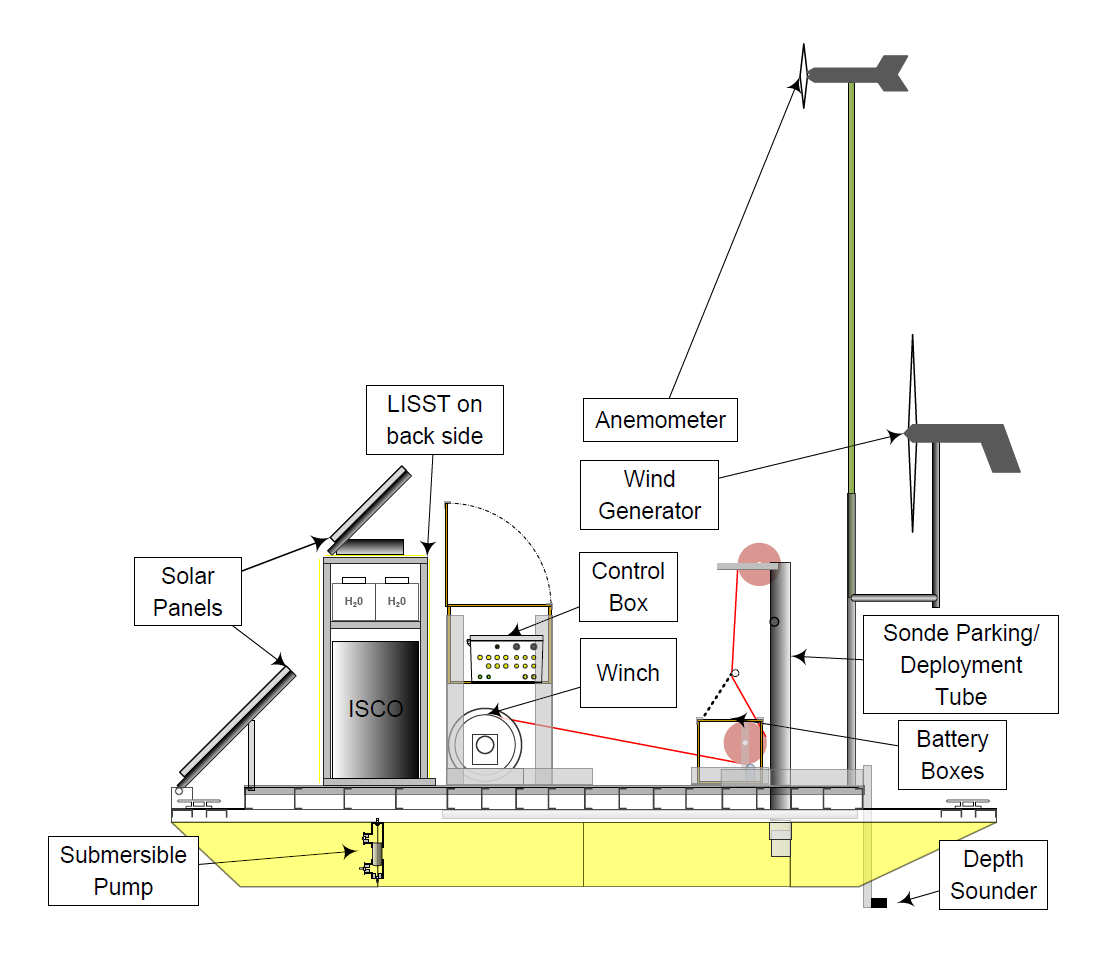
In addition to its profiling functions, the new profiler adds a number of additional current and future capabilities. The new profiler hosts an ISCO Portable sampler which is used in conjunction with the profiler’s functions to sample a desired volume of water from any depth. The ISCO has 24 sample bottles which when full are retrieved to the lab for analysis. The new platform also has a LISST-StreamSide laser particle size analyzer. This allows us to measure particle size and distribution data through the water column as we are collecting profile data. The profiler is designed to profile to at least 30 meters of depth at various speeds and resolutions. The new platform has increased power generating capacity through both solar and wind allowing us to support instruments which may have higher power requirements even during short days of winter.
Controller hardware is based on an Intel atom processor in a standardized PC/104 form factor running Linux. The new profiler’s hardware and software have been designed to allow the easy future integration of additional instruments. Additional expansion ports are provided for future instruments. Software was written in Python and Java in a modular and easily expandable manner. An application programming interface (API) was developed allowing new software modules to be programmed in almost any language. The new profiler’s software was also developed in a way that has potential applications beyond the AVP. Any system requiring the capabilities to collect and process data from disparate sources while controlling external equipment might benefit.
Profilers were deployed in the New River as part of the Strategic Environmental Research and Development Program. Data from the new profiler design is immediately copied to a database at IMS via a full time high speed modem connection, processed and made available on the web.
The data from the profilers has been used for many purposes including:
- Documenting the frequent occurrence of wind driven upwelling along the shores of the Neuse River estuary and the role that this plays in bringing low oxygen water to the surface with its potential to kill fish.
- Documenting a pervasive daily vertical migration of the flagellated microalgae in the water column. These algae swim upward toward the surface during the day where they have greater access sunlight and deeper at night where nutrients are in greater supply. Documenting these migration patterns on such fine temporal and spatial scales provides information that is useful for determining how these flagellated species form blooms in our local estuaries.
- Sampling for water column pathogens under a variety of conditions including during and after storms. These data help in developing more accurate pathogen predictive models by actively collecting water samples throughout ‘extreme’ conditions (e.g. wind and storm events) which we would not be able to normally sample. Pathogen model performance improves by including pathogen concentration data that is not biased toward fair weather conditions. Besides pathogen prediction, this data provides information on pathogen dynamics (e.g. fate and transport).
- Determining conditions that cause water column mixing and sediment resuspension. Sediments contain nutrients, biological material and possibly contaminants so knowing when sediment resuspension has occurred is aids in understanding water quality dynamics.
Intelligent Vertical Profiling Systems
After many years of designing building and deploying platforms for autonomous vertical profiling, our experience is being leveraged into a line of commercial products to make water column profiling easier than ever before. The first of these products is which can be used to precisely position sensors and to continuously pass along their real-time data stream. The Intelligent Winch, was sold to Spanish company EcoHydros and has been deployed in a reservoir near Ávila Spain. The second device is an intelligent cable tension monitoring system which is designed to supplement the winch and stop it when the cable tension becomes out of tolerance.
Sediment Resuspension
Several years of data collection using the autonomous vertical profilers at two sites in the New River Estuary have helped to reveal the physical mechanisms that control turbidity.
- Automatically collects profile every 30 minutes of:
- Temperature
- Salinity
- Dissolved Oxygen
- pH
- Chlorophyll concentration
- Turbidity
- Vertical resolution of 5-10 cm
- Collects wind speed and direction
- Nearly continuous data from June 2008-present
- Acoustic Doppler Current Profilers (ADCPs)
- Deployed at each site simultaneously
- Mid July through mid December 2009
- Mounted in tubes nearly flush with estuary floor
- Average currents collected every six minutes
- Ten cm vertical resolution
- Fast ping rate mode (mode 12) with 20 pings per ensemble
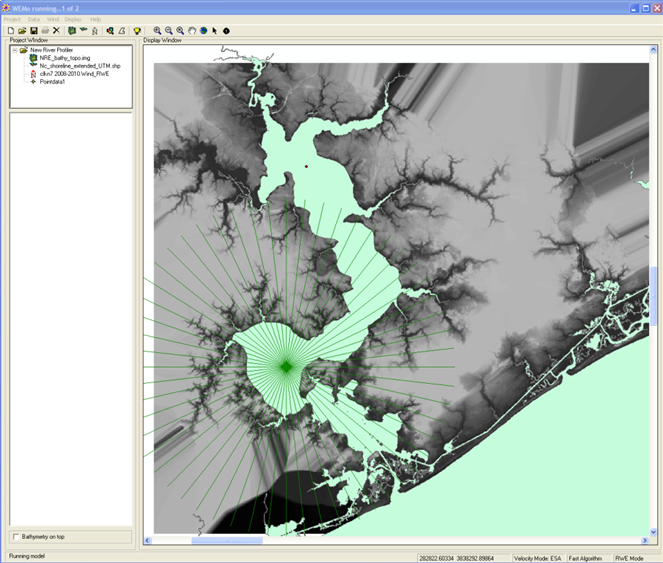
- Used NOAA Wave Exposure Model (WEMo)
- Wave parameters calculated:
- Wave Height
- Wave Period
- Orbital Velocity
- Shear Stress
- Shear Velocity
- Calculated for 56 evenly spaced rays
- Calculated for 0-20 m/s wind
- Wave parameter time series generated using interpolated table lookup based on local (AVP) wind direction and speed
Turbidity in the New River is driven principally by wave-orbital based bottom shear stress and advection. A shear stress value that is spatially integrated in the direction from which the water is coming is a better predictor of turbidity than the local shear stress. This work is available in Estuarine, Coastal and Shelf Science as: Whipple AC, Luettich RA, Reynolds-Fleming JV, Neve RH,Spatial differences in wind-driven sediment resuspension in a shallow, coastal estuary.
FerryMon: Redesign of data collection system using NC Ferries as ships of opportunity
The FerryMon program utilizes two NC-DOT ferries outfitted with continuous, flow-thru water quality measurement systems that operate along routes that are near to or go through areas nominated as strategic habitat areas. The project objective is to use FerryMon to establish the status and trends in water column habitat conditions in the Pamlico Sound and Neuse River. The continuous nature of the FerryMon data collection capabilities also serves as an early warning system for significant changes in water quality conditions.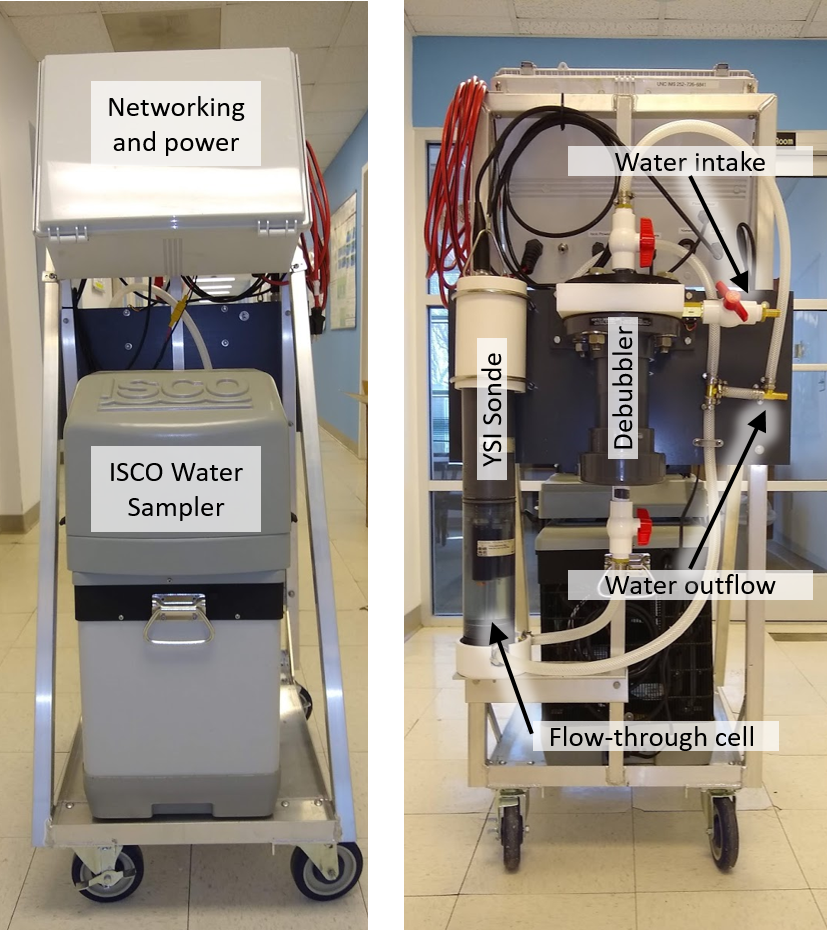
The engine room cart works by taking seawater provided by the ferry from the vessel’s raw-water intake. A series of valves controls the water flow rate, which is monitored by a small flow sensor just past the intake valve. Water then flows through a de-bubbling device, since air bubbles attaching themselves to the water-quality instrument probes can affect the readings. The de-bubbled water then goes to a flow-through cell, which is part of the YSI Sonde where the water quality sensors measure water temperature, salinity, pH, oxygen concentration, chlorophyll concentration, and turbidity. The water then flows to the ISCO water sampler intake where samples can be drawn on command from a shore-side operator or automatically which can be transported back to UNC-IMS lab for nutrient, molecular/microbiological analyses. Finally, the water goes through the outflow and is returned to the ships plumbing.
The control module, located on the bridge of the ferry, receives data from a wired network cable attached to the engine-room cart. Using the GPS attached to the control module, water quality sampling begins as soon as the ferry has cleared the ferry terminal and is in the open river. Sampling is terminated when the ferry nears the terminal on the other side. Wind speed and direction are constantly monitored.
This system allows the public to view the dynamic water quality data via a link on our website Neuse River Real Time Data. Data flows from an on-board database to a duplicate copy on lab servers in real-time. These data are immediately available and displayed via the web. This eliminates delays in observing significant water quality events such as algal blooms, influence of storm-related floodwaters, associated changes in water clarity (turbidity) and salinity impacting water quality and fisheries habitat.
Coastal HF Radar at Core Banks
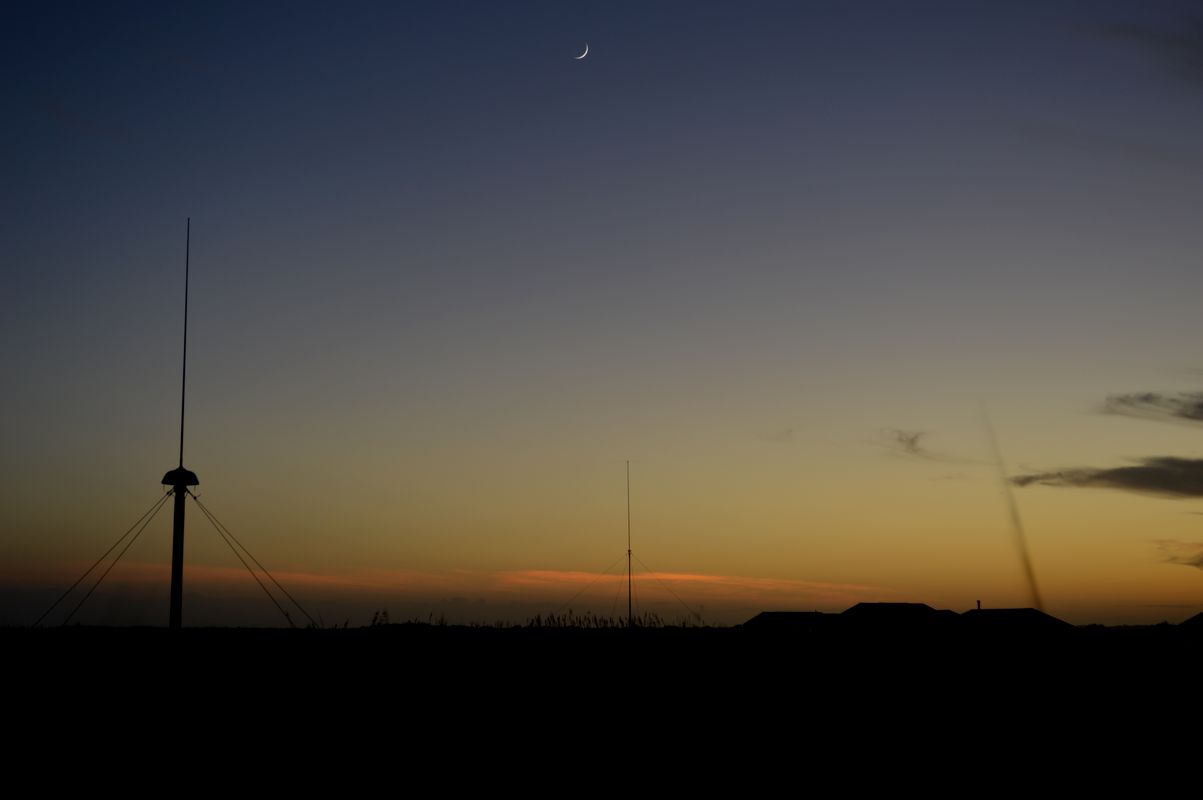 An HF coastal radar (Codar) system was deployed on Core Banks late in 2013. The radar measures surface velocities of the coastal ocean out to approximately 200 km in conjunction with a network of other radar systems. Each radar measures velocities directed radially inward toward the antenna site by measuring the Doppler shift of waves of a specific wavelength. The deviation of the measured wave speed from the speed that these waves would travel in still water is due to the current. Radial vectors from two or more radar sites are then combined to determine the total surface current speed and direction. The data are being used for multiple purposes including analyzing the energy potential in the Gulf Stream, observing the coastal circulation in the Cape Hatteras region and for search and rescue. Data are accessible through the North Carolina Coastal Ocean Observing System web site at http://nccoos.org/platforms/hfradar, and further processed data are distributed through the national HF radar network.
Turbulence Measurement Techniques in the Presence of Waves
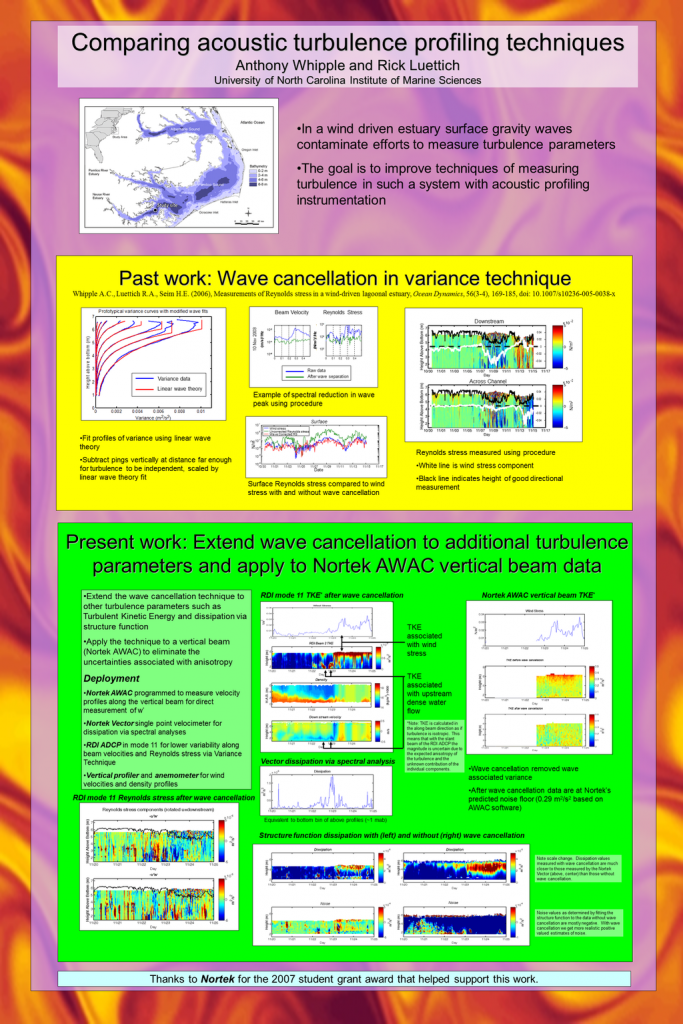
When measuring turbulence any motion due to mean currents and/or waves must be separated from the observed velocities. In shallow water or in near surface regions the motion due to surface gravity waves can dominate that of turbulence by an order of magnitude or more. There are techniques of measuring turbulence which use an Acoustic Doppler Current Profiler (ADCP) to measure Reynolds stress, turbulent kinetic energy, and/or dissipation in a profile throughout the entire water column. Each of these techniques can be improved by removing the motion of waves prior to their application. A method for removing the wave motion was developed which uses a best fit of the linear wave theory model of variance as a function of depth to the ADCP along beam variance. This method is summarized in the poster included here and fully described in Whipple A.C., Luettich R.A., Seim H.E. (2006), Measurements of Reynolds stress in a wind-driven lagoonal estuary, Ocean Dynamics, 56(3-4), 169-185, doi: 10.1007/s10236-005-0038-x, and was extended in Whipple AC, Luettich RA, (2009) A comparison of acoustic turbulence profiling techniques in the presence of waves. Ocean Dynamics: 59 (5), 719-729, doi: 10.1007/s10236-009-0208-3.